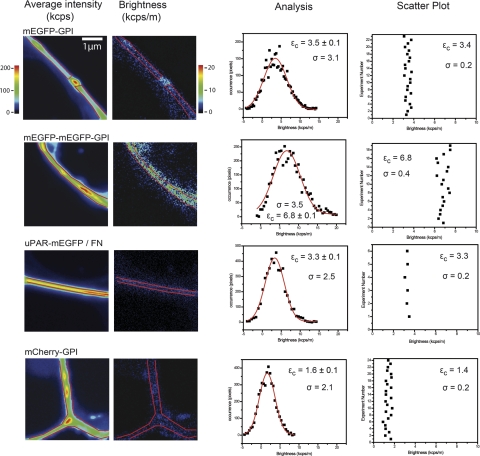
Figure 6.
Control experiments. From left to right: representative average fluorescence intensity and molecular brightness images, brightness histogram analysis, and scatter plots of εc values from replicate experiments on mEGFP-GPI, mEGFP-mEGFP-GPI, uPAR-mEGFP-GPI, and mCherrry-GPI. All constructs were expressed in HEK293 cells, and with the exception of uPAR-mEGFP, cells were imaged in serum-rich medium. uPAR-mEGFP/cells were plated on fibronectin matrices and maintained in serum-free medium during the experiment. Central brightness εc and fit error (±) were obtained as in Fig. 4. Scatter plots show mean ± sd central brightness values from replicate experiments. σ = sd.

