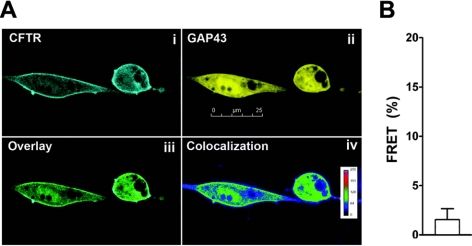
Figure 3.
CFTR and GAP43 colocalize but do not undergo FRET. A) Images of CFTRcfp (i) and GAP43yfp (ii) coexpressed in BHK cells, along with an overlay of these two images (iii) and a graphical representation of the degree of colocalization (iv), obtained using Image J. B) Mean acceptor photobleaching percentage FRET between CFTRcfp and GAP43yfp expressed in BHK cells. Data did not differ significantly from 0; n = 6. Scale bar = 25 μm.

