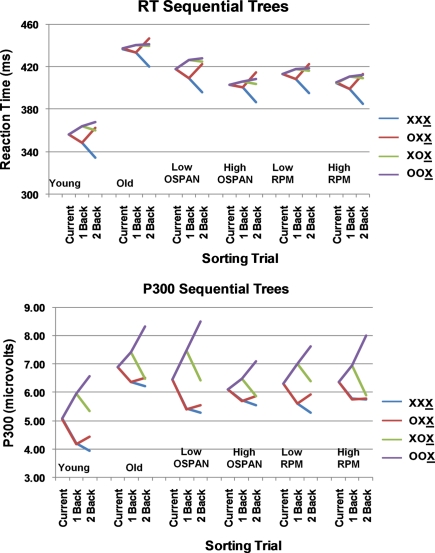
Figure 1.
Reaction time (RT; top) and P300 sequential trees (bottom). Trees indicate the RT/P300 amplitude elicited by stimulus X as a function of the preceding two stimuli (1-back, 2-back in the sequential trees) for the various subject groupings. In the RT trees, the ordinate is time in milliseconds; in the P300 trees, the ordinate is the amplitude of the P300 in microvolts. The four different colors represent the four possible sequential conditions (with the underlined X indicating the current stimulus).

