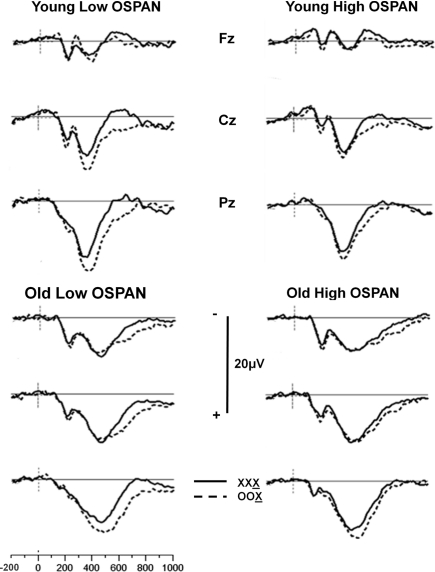
Figure 2.
Grand average waveforms of stimulus X as a function of the preceding two stimuli for the Fz, Cz, and Pz electrode sites for younger and older adults split into high- and low OSPAN groups. Solid line: no change condition (XXX, where X is the current stimulus); dashed line: most extreme change condition (OOX, where X is the current stimulus).

