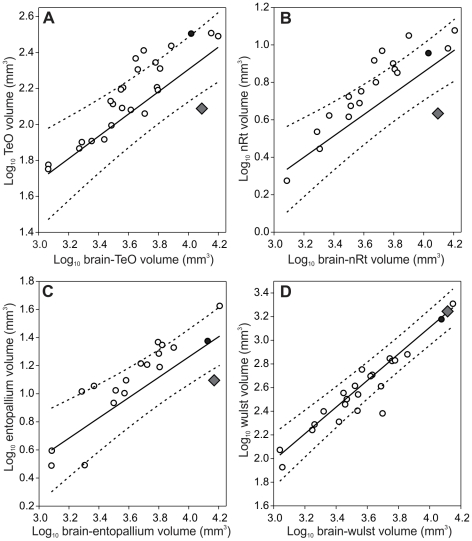
Figure 2. Scatterplots of each of the four visual brain regions measured against total brain volume.
A, optic tectum (TeO); B, nucleus rotundus (nRt); C, entopallium; and D, Wulst. All measurements in mm3. The solid lines indicate the least-squares linear regression lines and dotted lines indicate the phylogeny-corrected 95% confidence interval. The diamond represents the Kakapo (Strigops habroptilus), the filled circle represents the Kea (Nestor notabilis) and open circles represent other parrot species included in the analyses.

