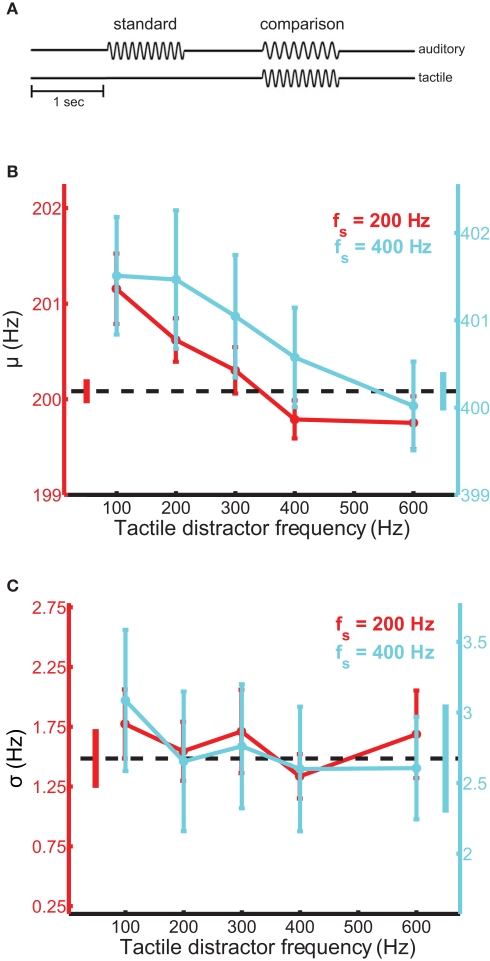
Figure 1.
Auditory frequency discrimination in the presence of tactile distractors. (A) Experimental design. Tactile distractors were delivered in the interval containing the comparison stimulus, which was randomized across trials. (B) Mean bias estimates (PSE) averaged across participants in the frequency discrimination experiments with the 200-Hz (red trace) and 400-Hz (cyan trace) standards, as a function of distractor frequency. The black dashed line and untethered bars correspond to baseline and SEM, respectively. Error bars indicate SEM. Bias estimates were significantly modulated by distractor frequency. (C) Mean sensitivity estimates averaged across participants in the frequency discrimination experiments. Conventions as in (B). Sensitivity did not depend on distractor frequency.

