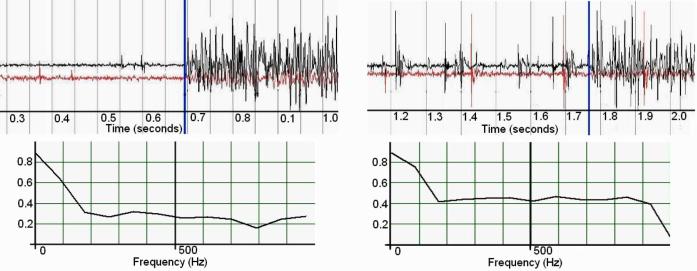
Fig. 17.
(Left) Intact medial gastrocnemius nerve. (Right) Medial gastrocnemius de-enervated. Both graphs show onset of crossed extension reflex. Normalized (voltage) raw EMG (top) top trace is soleus, bottom trace is medial gastrocnemius. Vertical bar indicates reflex onset. Magnitude-squared coherence (bottom)—on the left is the MSC before denervation, on the right is MSC postdenervation. Nominal frequency bin size 87.9 Hz.

