Fig 1.
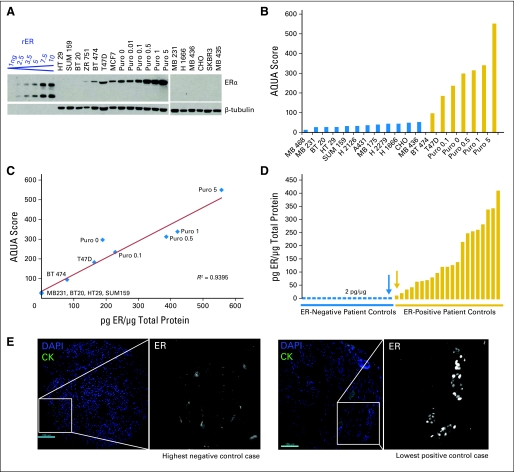
Method for quantification of estrogen receptor (ER) using an immunoblot-standardized automated quantitative analysis (AQUA) assay. (A) ER was measured in a panel of cell line controls by western blot (1D5 antibody; DAKO, Copenhagen, Denmark) alongside a standard curve of recombinant ER (rER) to determine absolute concentration in picograms per microgram of total protein. Cell lines included Puro9 cells, which are MCF-7 cells with doxycycline-induced overexpression of ER (0, 0.01, 0.1, 0.5, 1, and 5 mg/mL doxycycline). Cell lines were also pelleted, cored, and placed on the index tissue microarray for immunofluoresence and AQUA analysis. (B) Absolute concentrations of ER (picograms per microgram) were correlated to ER expression by immunofluoresence (AQUA score using 1D5), and the regression (C) was used to convert AQUA scores to concentrations of ER (picograms per microgram) in the set of patient controls present on the same index tissue microarray; (D) shows picograms per microgram distribution. Immunofluorescent AQUA images of ER in the highest negative control case (blue arrow) and the lowest positive control case (gold arrow) are also shown in (E) to validate the cut point. Cytokeratin (CK) was used as a mask to define regions of tumor. For ER, we contracted the dynamic range of the grayscale image (adjusted maximum red-green-blue input level from 255 to 16 by using Adobe Photoshop) to visualize low levels of specific nuclear staining as well as nonspecific background. DAPI, 4,6-diamidino-2-phenylindole.

