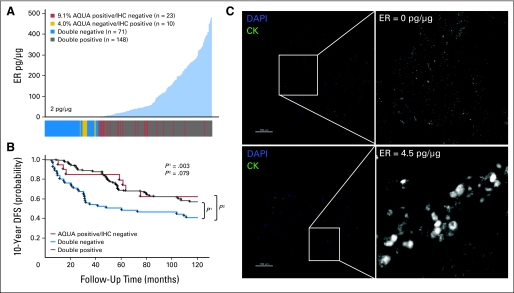
Fig 2.
Discordant classification of estrogen receptor (ER) status in YTMA 49 cohort. (A) ER status was determined by immunofluorescence and automated quantitative analysis (AQUA) in Yale retrospective breast cancer cohort YTMA 49 (diagnosed between 1962 and 1982; clinicopathologic characteristics provided in Appendix Table A1) and compared with ER status as determined by immunohistochemistry (IHC), read by two certified pathologists (M.H. and D.L.R.) using the current 1% positive nuclei cutoff guidelines. Distribution of ER by AQUA (picograms per microgram standardized as illustrated in Fig 1) is shown in which each case is color coded in the bar below, according to its ER status by both AQUA and IHC. (B) Kaplan-Meier curves show 10-year disease-free survival (DFS), in which patients are grouped according to the classifications shown in (A). The AQUA-negative/IHC-positive group (n = 10) was excluded from survival analysis on account of small size and insufficient power. (C) To confirm and further validate the AQUA cut point of 2 pg/μg in this cohort, representative immunofluorescence images of ER staining for patients on either side of the cut point are shown (right panels). Cytokeratin (CK) was used as a mask to define regions of tumor (green, left panels). For ER, we contracted the dynamic range of the grayscale image (adjusted maximum red-green-blue input level from 255 to 16 by using Adobe Photoshop) to visualize low levels of specific nuclear staining as well as nonspecific background. DAPI, 4,6-diamidino-2-phenylindole.

