
Figure 3.
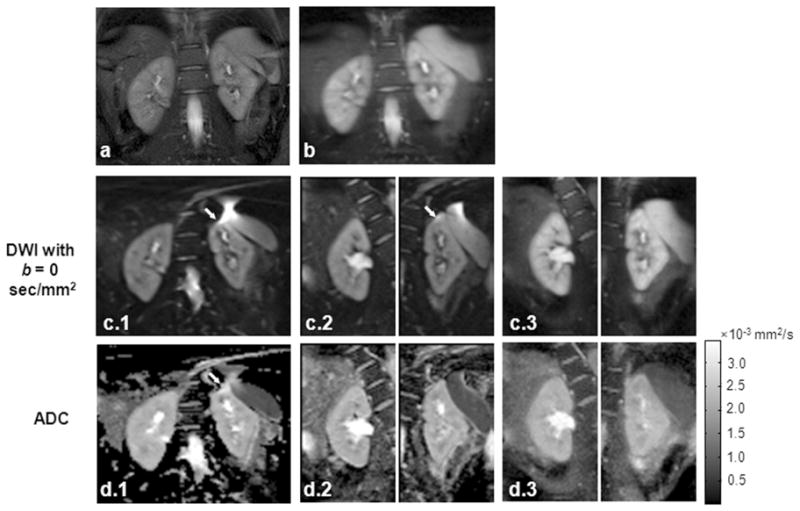
Second representative in vivo example: (a) coronal TSE localization image, (b) full-FOV DW-SPLICE image at b = 0 sec/mm2, (c–d) DW images at b = 0 sec/mm2 (c) and their corresponding ADC (d) maps acquired using single-shot DW-SE-EPI (Group 1), targeted-DW-SE-EPI (Group 2) and targeted-DW-SPLICE (Group 3). Chemical-shift artifacts are observed within the left kidney for both single-shot DW-SE-EPI and targeted-DW-SE-EPI images (arrows in c and d).