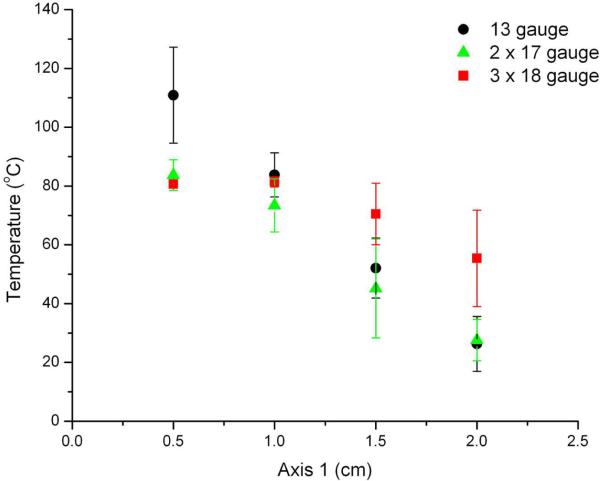
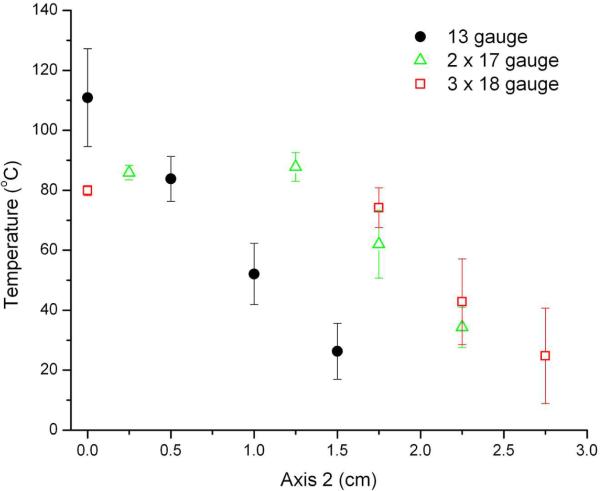
Figure 5.
Maximum tissue temperatures recorded along Axis 1 (A) and Axis 2 (B) shown in Figure 2. Temperatures near the center of the target tissue were highest during ablations performed using a single 13-gauge antenna. Ablations performed with three 18-gauge antennas resulted in the highest temperatures near the periphery (>1.5 cm from the center of the tissue) as well as the most uniform temperature distribution.


