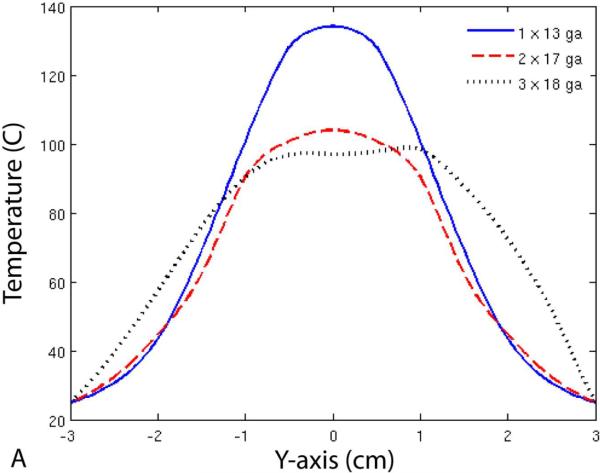
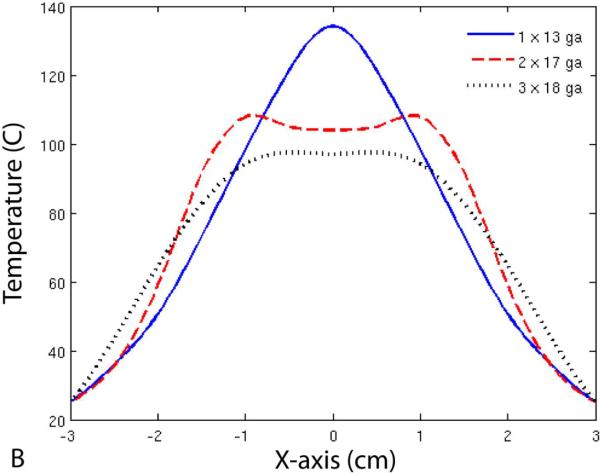
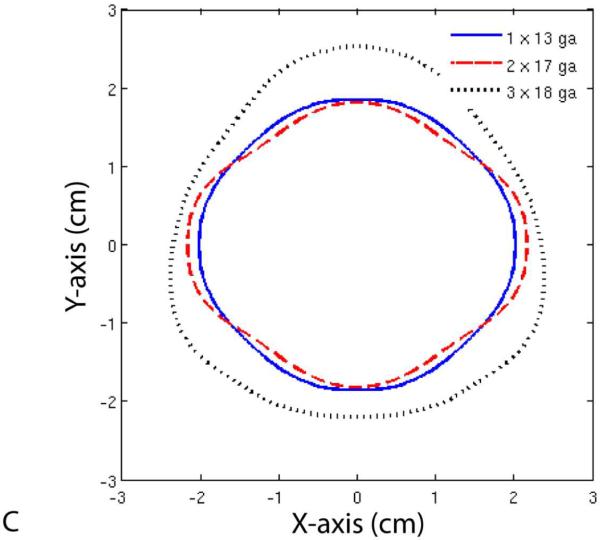
Figure 6.
Temperature profiles (A, B) and 50 °C isotherms (C) for single- and multiple-antenna groups. Note that the 50 °C isotherms during two-antenna ablations were greater than during single-antenna ablations along the axis of the antennas (B), but not perpendicular to it (A). In contrast, ablations with three 18-gauge antennas resulted in greater 50 °C isotherms in all directions when compared with those performed with one 13-gauge or two 17-gauge antennas.


