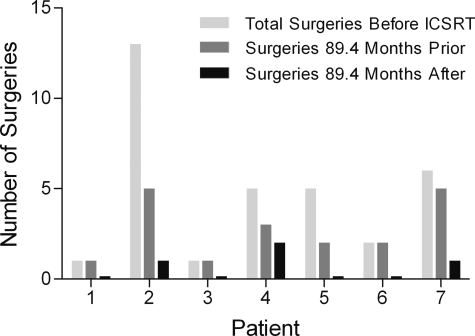
Fig. 3.
Surgical interventions before and after ICSRT. The number of surgeries is depicted by a set of 3 bars for each patient: the first being the total number of surgeries the patient had before ICSRT, the second the number of surgeries in the mean of 89.2 months before ICSRT, and the third the number of surgeries in the mean of 89.2 months after ICSRT. Noted is a significant decrease of the number of surgeries the patients had after their radiation therapy.

