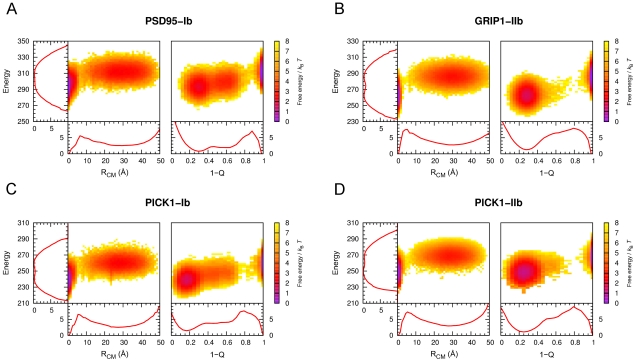
Figure 5. Peptide binding free energy surfaces for PSD95-Ib, GRIP1-IIb, PICK1-Ib, and PICK1-IIb, at .
 . Free energies are calculated using
  , where
  is the joint probability distribution in total energy, E, and
  or
or  . The one-dimensional free energy profiles are obtained from the corresponding marginal distributions. PSD95-Ib and GRIP1-IIb free energies were calculated directly from fixed-T MC simulations at the respective
  . PICK1-Ib and PICK1-IIb simulations were performed at
  and
and  , respectively. Free energies at the midpoints (
 for PICK1-Ib and
  for PICK1-IIb, determined from the
  maxima) were obtained using single-histogram reweighting [64].

