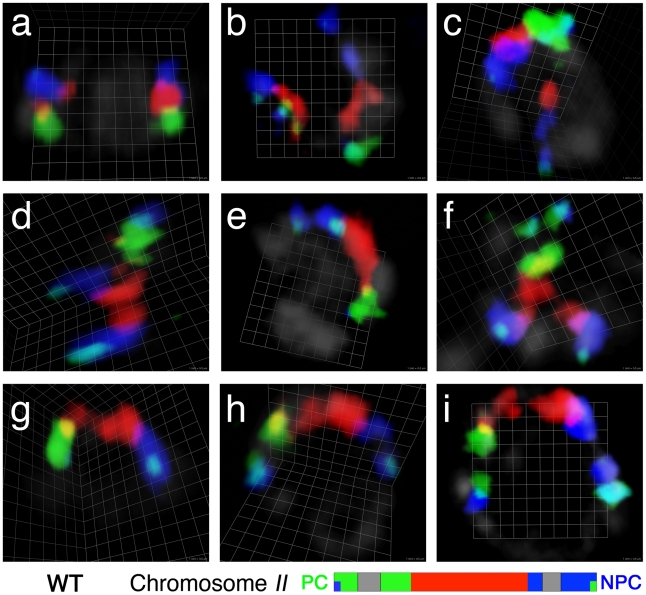
Figure 1. Visualization of chromosome II territories using multicolor chromosome paints.
Each panel shows a three-dimensional rendered image of the chromosome II pair in a single wild-type nucleus from a whole-mount gonad, reconstructed from optical sectioning confocal microscopy; the chromosomes are visualized using a multicolor chromosome paint FISH probe, which is depicted schematically below. Three different fluorescent dyes are assigned to each of three segments of chromosome II: Alexa-488 to the left segment (green), Alexa-555 to the central segment (red) and Alexa-647 to the right segment (blue). (Details of the labeling scheme are in Table S1). The left and right ends of the chromosomes are double-labeled with a second fluorescent dye (Alexa-647 and Alexa-488, respectively), and appear light blue in color as a result of the colocalization of the two dyes. In this and other figures, gray segments in the schematic indicate regions of the chromosome that were not represented in the probe; PC indicates the pairing center end and NPC represents the non-pairing center end of the relevant chromosome. In the images, DAPI counter stain is shown in light gray. (a) A nucleus in the pre-meiotic zone, in which the two homologous chromosomes are seen in compact territories. (b–g) Nuclei from the transition zone (TZ), the region of the germ line where chromosome territories become longitudinally extended and pairing is established. Within the TZ, homologs can be: (b) not aligned; (c–f) partially aligned; or (g) fully aligned. (h and i) Nuclei from the pachytene zone, in which fully aligned homologous chromosomes are seen in a single chromosome territory progressively extending during pachytene progression. Scale is shown by the square grid in the background of each panel, with 0.5 µm as the length of each side of the unit square.

