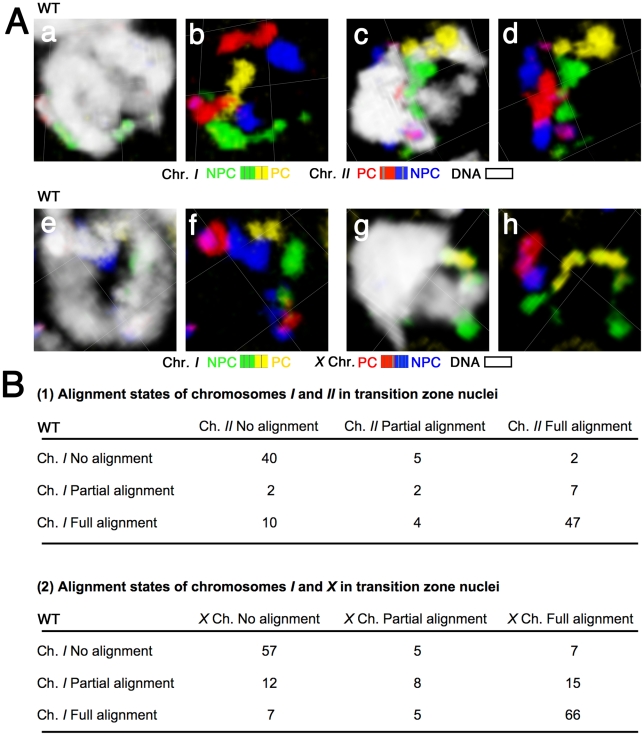
Figure 3. Chromosomes do not exhibit a temporal hierarchy for homolog alignment in the transition zone.
(A) Three-dimensional rendered paint images of chromosomes I and II (a–d), and chromosomes I and X (e–h) in individual nuclei from the transition zone. Chromosomes I and II are painted as in Figure 2A. The X chromosome is painted with Alexa-594 (red) on the left half and Alexa-647 (blue) on the right half. DAPI counter staining is shown in white. (a, b) a fully aligned chromosome I pair is seen as a single territory, whereas two distinct chromosome II territories indicate a lack of association between the chromosome II homologs. (c, d) full alignment of chromosome I and partial alignment (in the red segment) of chromosome II. (e, f) fully aligned chromosome I and no association between the X chromosomes. (g, h) full alignment of the X chromosomes and partial alignment (in the yellow segment) of chromosome I. Scale is shown by the square grid in the background of each panel, with 3.8 µm as the length of each side of the unit square. (B) Matrices presenting quantitative analysis of chromosome alignment states in transition zone nuclei. Nuclei were classified into nine categories based on the alignment states of chromosomes I and II (Part 1, n = 119 nuclei) or chromosomes I and X (Part 2, n = 182 nuclei).

