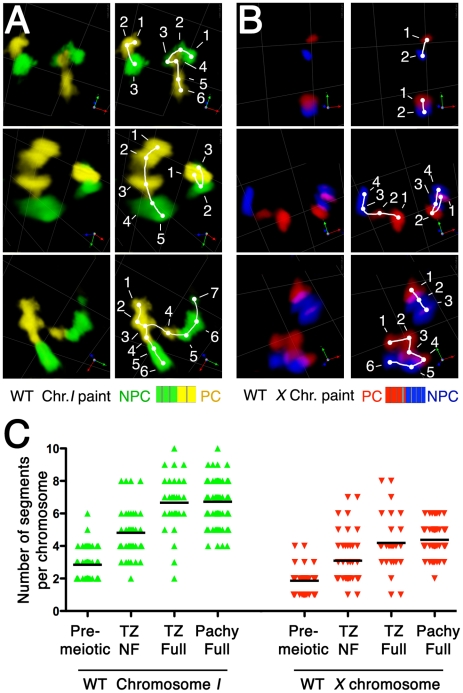
Figure 6. Increase in number of painted chromosome segments accompanies elongation of chromosome territories.
(A and B) Pairs of images depicting quantitation of painted chromosome segments, which increase in number in parallel with longitudinal extension of chromosome territories. (A) The left half of chromosome I is painted by Alexa-488 (green) and the right half is painted by Alexa-532 (yellow). (B) The left half of the X chromosome is painted by Alexa-594 (red) and the right half is painted by Alexa-647 (blue). For each nucleus depicted in A and B, in the right-hand panels, visually discernable painted chromosomal segments are marked with dots, which are numbered sequentially and are connected by a line tracing the path of the chromosome territory. Scale is shown by the square grid in the background of each panel, with 3.8 µm as the length of each side of the unit square. (C) Quantification of the numbers of painted chromosome segments in nuclei from the pre-meiotic zone, the transition zone (TZ) and the early pachytene zone (Pachy Full). The chromosome territories in the transition zone were subdivided into two groups based on the status of alignment: fully aligned (TZ Full) and not-fully aligned (TZ NF). The numbers of painted segments per chromosome in individual nuclei of each sample are displayed as scatter plots, with a horizontal black line showing the average.

