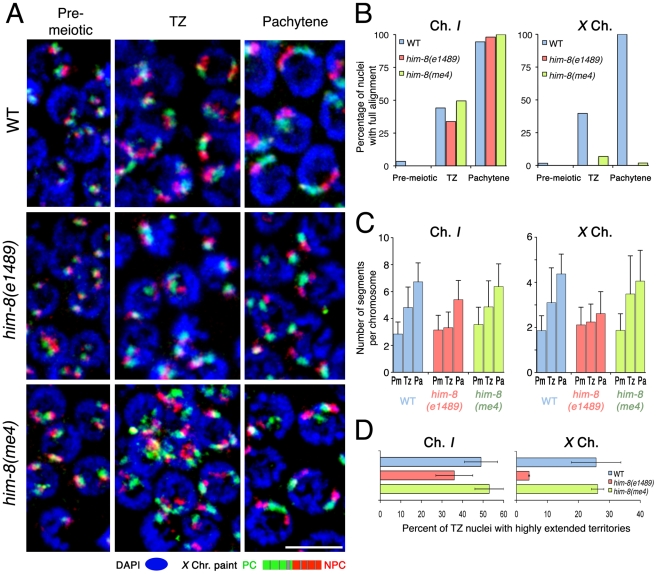
Figure 8. Roles for pairing center binding protein HIM-8 in elongation of X chromosome territories.
(A) Maximum intensity projections of paint images of the X chromosomes in nuclei from the indicated regions from wild type (upper), him-8(e1489) (middle) and him-8(me4) (bottom) germ lines. The X chromosome is painted with Alexa-594 (green) in the left half and Alexa-647 (red) in the right half. DAPI is in blue. Note that the him-8(e1489) mutant fails to show longitudinal extension either in the transition zone or at the pachytene stage, whereas him-8(me4) shows longitudinal extension of X at both stages (as in wild type) despite the fact that X chromosomes fail to align. (B) Percentage of nuclei that show full alignment of chromosome I (left) and X (right) in the pre-meiotic zone, the transition zone and the pachytene zone. Chromosome I fully aligns in both him-8(e1489) and him-8(me4) mutant as in the wild type, whereas the X chromosomes do not show any significant full alignment in either him-8 mutant. Scale Bar: 5 µm. (C) Numbers of painted segments per chromosome scored for chromosome I (left) and X (right) in nuclei from the pre-meiotic zone (Pm), the transition zone (Tz) and the pachytene zone (Pa) of germ lines of the indicated genotype. For the transition zone, only those nuclei that had not achieved full alignment were included in this analysis (see Figure 3D). For each genotype, nuclei from three gonads were scored; error bars indicate standard deviation. (D) Percentage of transition zone nuclei exhibiting highly extended chromosome territories. Chromosome territories were scored as “highly extended” if they exhibited an elongated thread-like morphology that was clearly distinguishable from the compact ovoid shape characteristic of pre-meiotic nuclei; these chromosomes had a slenderness ratio of >6. For each of the indicated genotypes, nuclei from three gonads were scored; error bars indicate standard error of the mean.

