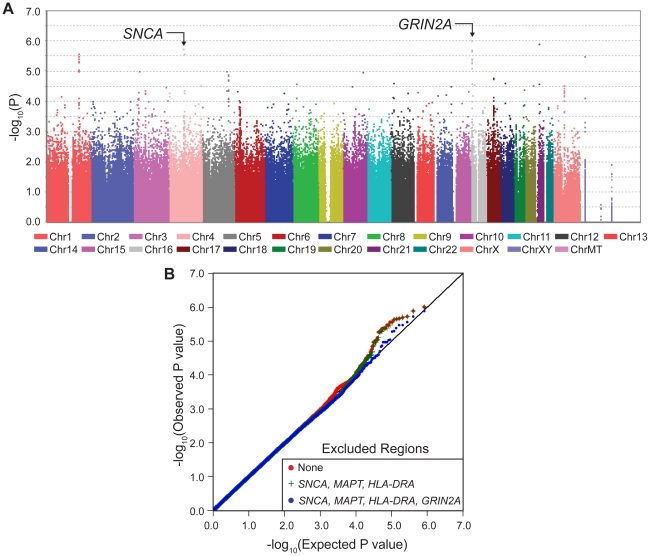
Figure 1. Manhattan Plot and QQ Plot of GWAIS.
Panel A depicts the Manhattan plot for the GWAIS (joint test of association and interaction with coffee, 2df, adjusted for sex, age, PC1 and PC2). The novel spike on chromosome 16 corresponds to 12 GRIN2A SNPs that were genotyped. Imputed SNPs achieved P2df<5×10⁻⁸ (see Table 4). Additive model is shown here, Dominant and Recessive are in Figure S1. Dominant and Additive models yielded similar results for top hits (see Table 1). Panel B is the QQ plot where the observed P values (red line) are plotted against the expected P values under no association (straight black line). The plots were made first by including all genotyped SNPs (red), then excluding those in the SNCA, HLA and MAPT regions (green) and finally by excluding GRIN2A (blue).

