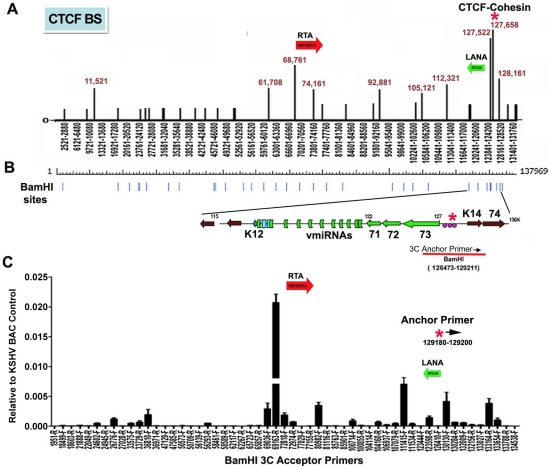
Figure 1. Chromatin conformation capture (3C) analysis of KSHV genome in BCBL1 latently infected B-cells.
A) Schematic map of CTCF binding sites in the KSHV genome. Positions at 11521, 61708, 68761, 74161, 92881, 105121, 112321, 127522, 127658, and 128436 have been validated by real-time PCR analysis of CTCF ChIP DNA. Other sites are predicted by consensus and experimentally identified at lower resolution by genome-wide array analysis. CTCF-cohesin binding site is indicated by red asterisk. Positions of the Rta gene (red arrow) and LANA gene (green arrow) are indicated. B) Map of BamHI sites in the KSHV genome. C) Real-time PCR analysis of 3C ligation products between an anchor primer (KSHV region 129180–129200, 5′ primer) with BamHI acceptor primers as indicated in the X-axis. The acceptor primers were designed from 5′ and 3′ end of BamHI fragments throughout KSHV genome. PCR products were quantified relative to BamHI religation products from Bac36A control reactions. Error bars indicate the standard deviation from the mean for three independent 3C reactions.

