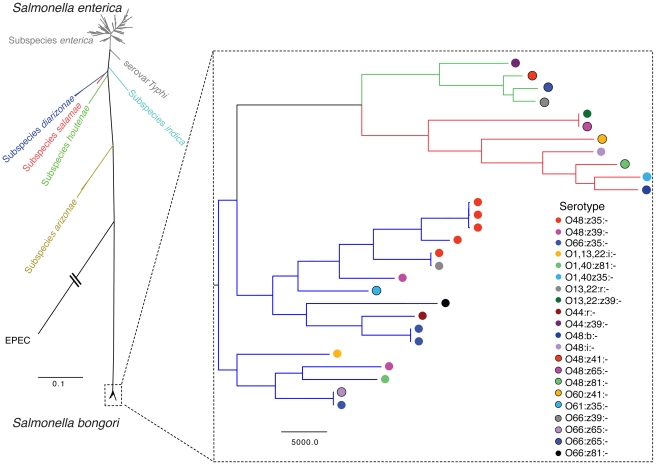
Figure 1. Maximum Likelihood Phylogenetic tree of Salmonella based on concatenated MLST loci.
The relationships of the isolates shown in the enlarged region were produced using a Maximum Likelihood phylogenetic tree of S. bongori based on the whole genome alignments produced by mapping sequence reads to the reference genome S. bongori 12419 (see [82]). The location for the root for the tree for the enlarged region was determined by using S. arizonae as an outgroup. The S. bongori isolates shown represent 21 different serotypes (SV), inferred by the coloured circles, the tree branches are coloured by BAPS cluster (SNP counts for each branch and strain labels for each node are in Figure S1).

