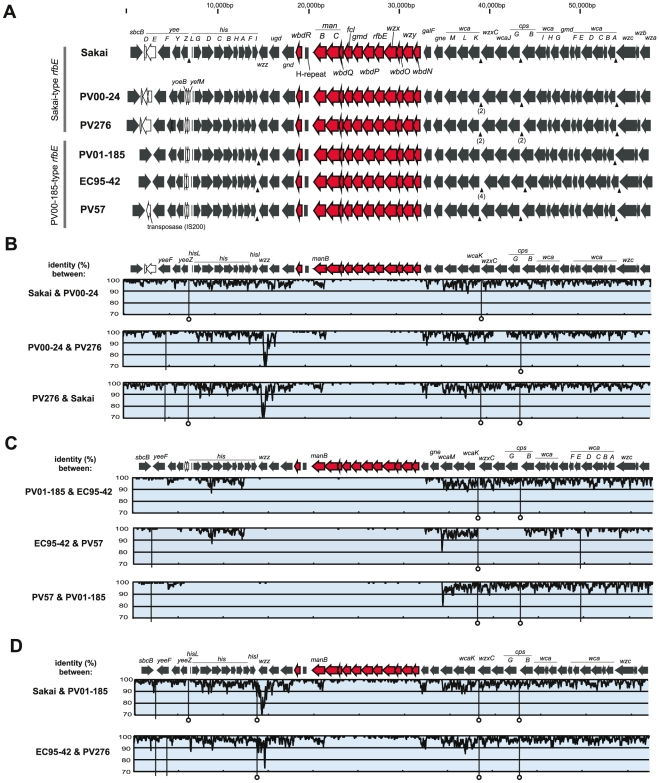
Figure 3. Comparisons of the O157-antigen biosynthesis gene clusters and their flanking regions in six O157 strains.
(A) Genetic organization of the O157-antigen gene clusters and their flanking regions. Red arrows indicate orthologs associated with the O157-antigen biosynthesis, and white arrows indicate ORFs that are not conserved in all six strains. Arrowheads indicate insertion sites of REP sequences. (B–D) Pairwise sequence comparisons. (B) Comparisons between O157 strains carrying “Sakai-type rfbE”. (C) Comparisons between O157 strains carrying “PV01-185-type rfbE”. (D) Comparisons between “Sakai-type rfbE” and “PV01-185-type rfbE” strains. Sakai is compared with PV01-185, and EC95-42 is compared with PV276. The genetic organization of the O157-antigen gene clusters and their flanking regions are shown in upper panels, and levels of % DNA sequence identity calculated with a 100 bp sliding window and a 10 bp step size are shown in lower panels. The vertical lines indicate regions showing insertion and/or deletion of fragments, and of them, lines with circular heads indi cate indels containing REP sequences.

