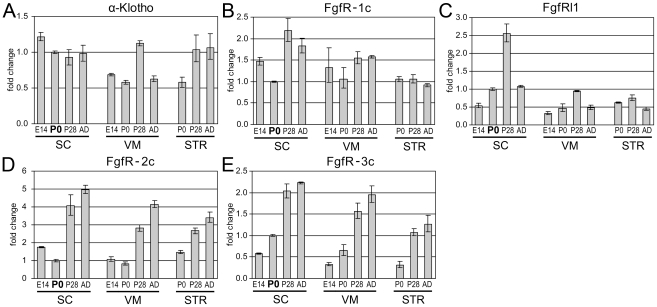
Figure 1. Expression profiles of the major FGF-receptors.
(A,B) Expression of α-Klotho (A) and FgfR-1c (B) remained stable throughout development of SC, VM and STR. (C) FgfRl1 was temporary up-regulated 5 fold in P28 SC and 3 fold in P28 VM, but remained stable in STR. (D,E) Expression of FgfR-2c (D) and FgfR-3c (E) increased in all three tissues in a range of 3–6 fold from E14.5 to AD stage, except SC FgfR-2c expression increased only 2.3 fold. Note the different scaling of the y-axis.

