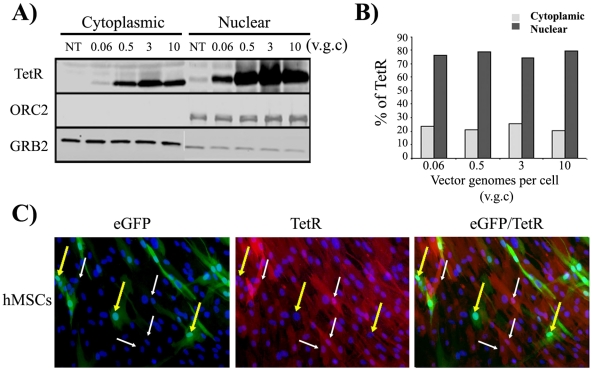
Figure 4. Nuclear localization of TetR repressor in CEST-transduced cells correlates with complete repression of CMV promoter.
A). Quantitative Western blot analysis showing TetR expression in cytoplasmic and nuclear fraction of 293 T cells transduced with increasing CEST MOIs. Cell fractionation was carried out as indicated in M&M. ORC2 and GRB2 were used as markers for the nuclear and cytoplasmic fraction respectively, and as a loading control. B). Graph showing percentage of TetR repressor that is present in the cytoplasmic (gray bars) and nuclear (black bars) fractions as determined by densitometry analysis of the Western blot (A). Note that the TetR protein is mainly localized within the nucleus, independently of the TetR concentration. C). Immunofluorescence staining of TetR in CEST transduced hMSCs (2 v.g.c.). Cells were fixed and incubated with monoclonal IgG1 against TetR amino acid 84-98 and incubated with DAPI (marking nuclei in blue) as indicated in M&M. Left panel shows a picture that has been manually enhanced to visualize minimally expressed eGFP. Middle and right pictures show TetR expression and eGFP/TetR merge images respectively. White arrows indicate cells which are completely negative for eGFP expression. Note the purple colour of these cells (middle and right panels) as consequence of the co-localization of DAPI (Blue) and red (TetR). Yellow arrows indicates cell expressing low levels of TetR repressor and, therefore expressing eGFP (left and right panels). The nuclei of these cells are intense blue (middle panel) indicating the absence of TetR expression. v.g.c.; vector genomes per cell. NT; not transduced.

