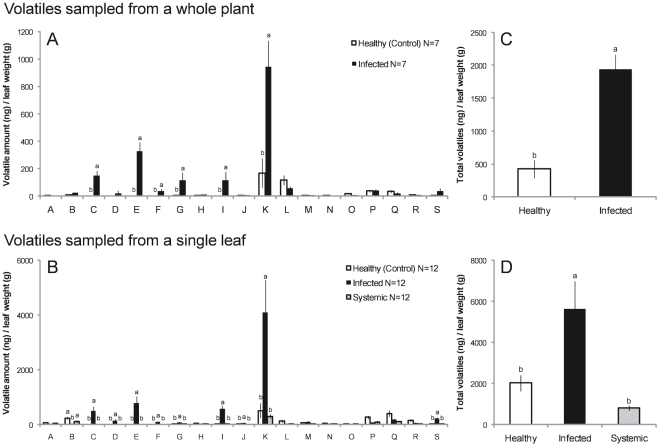
Figure 1. Amounts of volatiles (mean.
±SE) emitted from healthy and powdery mildew-infected plants in the greenhouse. Panels A and B show individual compounds from whole plants and single leaves, respectively: A, (E)-2-hexenal; B, (Z)-3-hexenol; C, unknown; D, 3-octanone; E, 1-octen-3-ol; F, 3-octanol; G, benzyl alcohol; H, (E)-β-ocimene; I, octanol; J, nonanal; K, linanlool; L, (E)-4,8-dimethyl-1,3,7-nonatriene; M, ethylbenzaldehyde; N, 4-ethylbenzaldehyde; O, nonanol; P, decanal; Q, ethylacetophenone; R, ethylacetophenone; S, decanol. (The pairs of compounds, (i) M and N and (ii) Q and R, were determined to be isomers of ethylbenzaldehyde and ethylacetophenone, respectively.) Panels C and D show total volatiles. “Systemic” refers leaves without powdery mildew on infected plants. Lowercase letters indicate significant differences among treatments (P<0.05 by ANOVA followed by Tukey-Kramer HSD).

