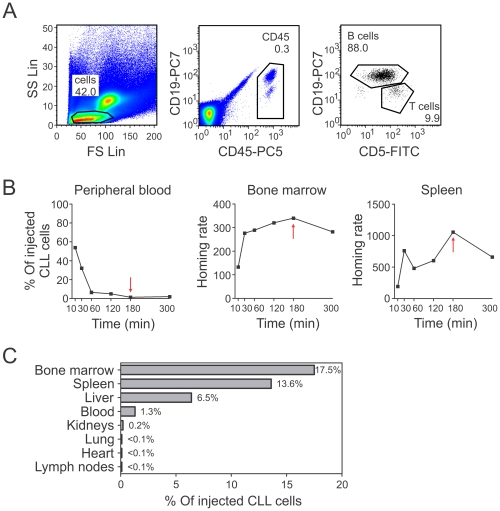
Figure 2. Homing capacity of CLL cells.
(A) Representative plots of human CLL and T cells in a BM sample from a NOD/SCID mouse acquired by flow cytometry. Total mouse and human lymphocytes were gated in the FS/SS plot. Human cells were identified by anti-human CD45 staining and were analyzed for their CD19 and CD5 expression. CLL cells were defined as CD19+CD5+ and T cells as CD19-CD5+. (B) Time course experiment. Percent of injected human CLL cells detected in PB, and BM and spleen homing rates at the indicated time points. The red arrow marks lowest (PB) and highest (BM and spleen) cell numbers. (C) Percentage of injected CLL cells from a high-risk patient detected in various organs of a NOD/SCID mouse 180 min after injection. Homing rates were normalized as described [12]: number of human cells analyzed per 106 mouse cells (total cells) per 106 injected viable human target cells.

