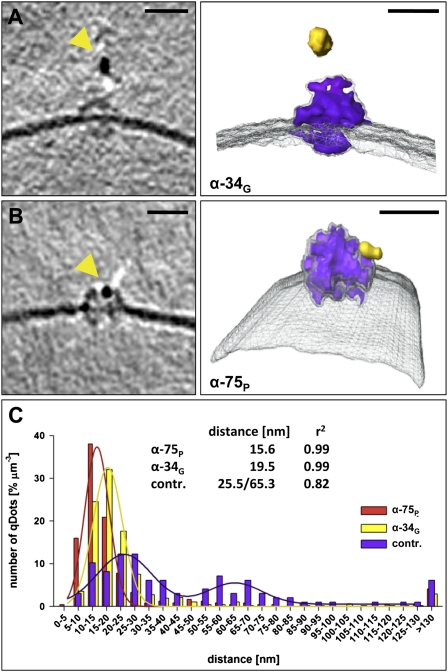
Fig. 5.
Qdot labeling of TOC complexes in outer envelope vesicles. (A and B) Tomographic slices and surface representations of single TOC complexes (purple), specifically labeled by Qdots (yellow) in the presence of domain-specific anti-Toc34 G(TPase) domain (α-34G; A) or anti-Toc75 P(OTRA) (α-75P; B) antibodies. Outer envelope vesicles without primary antibodies were used as control. (C) Quantification of the measured distances between the observed Qdots and the membrane. (Scale bars, 15 nm.)

