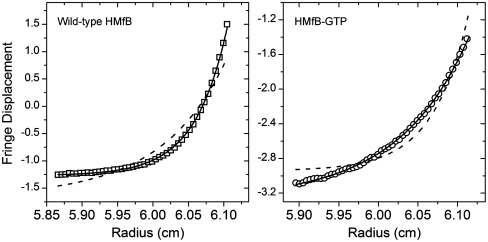
Fig. 2.
Sedimentation equilibrium in the analytical ultracentrifuge at 35,000 rpm and 20 °C for wild-type HMfB (squares, Left) and HMfB–GTP (circles, Right). Solid lines represent the expected distributions for a dimer (Left) and monomer (Right). Dashed lines show the best fits to the data assuming a monomeric wild-type HMfB (Left) and dimeric HMfB–GTP (Right). The buffer was 0.2 M KCl and 20 mM KPi at pH 7.2.

