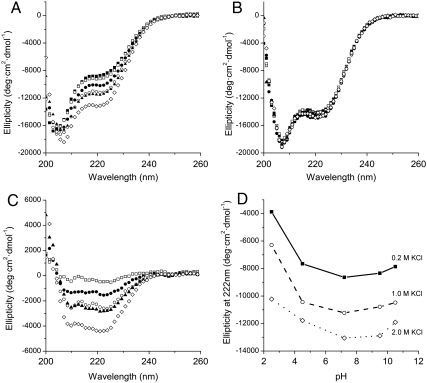
Fig. 3.
Effect of salt and pH on the secondary structure of wild-type HMfB and HMfB–GTP (A) Far-UV CD spectra of HMfB–GTP as a function of KCl concentration at pH 7.2 (20 mM KPi). The KCl concentrations are, from top to bottom, 0.2 M (▪), 0.5 M (□), 0.75 M (•),1.0 M (○), 1.5 M (▴), and 2.0 M (⋄). (B) Far-UV CD spectra of wild-type HMfB as a function of KCl concentration at pH 7.2. The buffer was 20 mM KPi and the temperature was 20 °C. The KCl concentrations are 0.2 M (▪), 0.5 M (□), 0.75 M (•), 1.0 M (○), 1.5 M (▴), and 2.0 M (⋄). (C) Change in ellipticity of HMfB–GTP compared to 0.2 M KCl upon addition of KCl. The KCl concentrations are, from top to bottom, 0.5 M (□), 0.75 M (•), 1.0 M (○), 1.5 M (▴), and 2.0 M (⋄). (D) Ellipticity of HMfB–GTP at varying pH conditions and 0.2 M (▪), 1.0 M (○), and 2.0 M (⋄) KCl.

