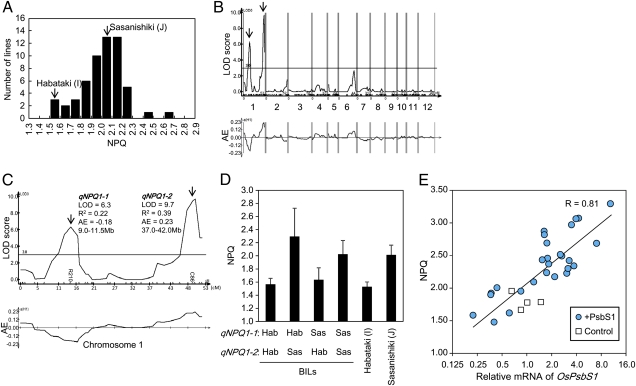
Fig. 3.
QTL analysis of NPQ regulator. (A) Frequency distribution of NPQ values of BILs. (B) Distribution of LOD scores and AE values along chromosomes. Positive AE values indicate positive effects of the Sasanishiki allele. (C) Magnification of chromosome 1. Maximum LOD scores, explained variances (R2), AE values, and approximate positions are shown for qNPQ1-1 and qNPQ1-2. (D) NPQ values of four BIL groups classified by genotypes of qNPQ1-1 and qNPQ1-2. Genotypes at qNPQ1-1 and qNPQ1-2 are represented by the genotypes of the markers R210 and C86. Habataki genotypes are indicated as “Hab” and Sasanishiki genotypes as “Sas.” Several lines heterozygous for either of the two loci were excluded from the calculation. Data represent means and SDs (n = 3 for each line). (E) Relationship between OsPsbS1 expression and NPQ value. Control (cultivar Kasalath) and transgenic lines harboring the OsPsbS1 gene driven by Ubi1 promoter (+PsbS1) were analyzed. Relative mRNA accumulations of OsPsbS1 and NPQ value under illumination at a PPFD of 1,500 μmol m−2 s−1 for 10 min were measured and plotted. Measurements were made on fully expanded leaves of first transgenic progenies. The solid line represents semilogarithmic regression and correlation coefficient (R).

