Fig. 4.
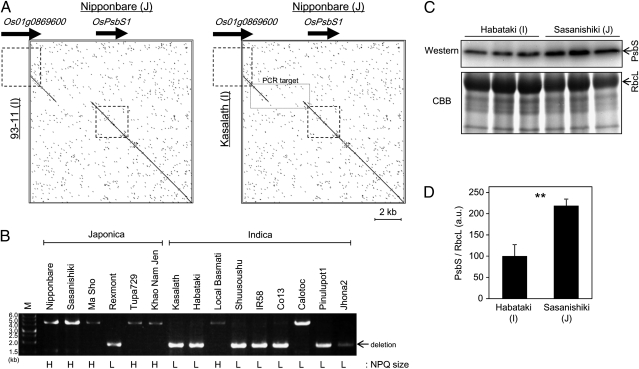
Comparison of PsbS between Indica and Japonica. (A) Genomic sequences of Indica cultivars (93–11 and Kasalath) and a Japonica cultivar (Nipponbare) were compared by using a dot-plot analysis (http://www.vivo.colostate.edu/molkit/dnadot) with a 9-base frame. Squares with broken lines represent genetic regions of Os01g0869600 and OsPsbS1 (from start codon to stop codon). Rectangle with solid lines in the box (Right) represents the target region of PCR in B. (B) PCR amplification of genomic sequence around the 2.7-kb deletion. M, molecular weight marker. NPQ groups of the cultivars analyzed are indicated below the gel image (L, low-NPQ group; H, high-NPQ group). (C) Total protein was extracted from expanded leaves of Habataki and Sasanishiki. PsbS protein accumulation was compared by Western blotting analysis. Total protein was also stained with CBB. RbcL, large subunit of RuBisCO. (D) Quantification of PsbS band intensity relative to RbcL band intensity. Data represent means and SDs. Values were significantly different by Student t test (P < 0.01); n = 3.

