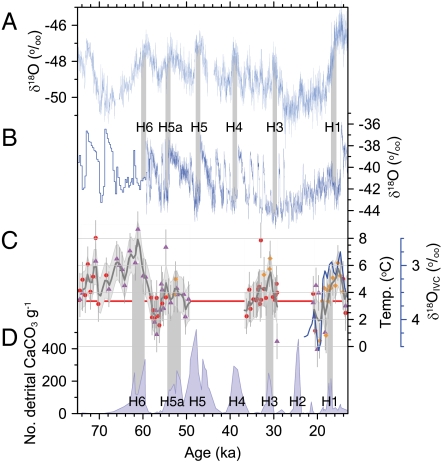
Fig. 2.
(A) δ18O record from Antarctic EPICA (European Project for Ice Coring in Antarctica) Dronning Maud Land ice core (37) on revised age model (38). (B) δ18O record from the North Greenland Ice Core Project ice core (39) on revised age model (38) (< 60 ka) and from Greenland Ice Core Project 2 ice core (> 60 ka) on published age model (40). (C) Mg/Ca-derived bottom water temperatures for core EW9302-2JPC (1,251 m, 48°47.70′N, 45°05.09′W). Orange diamonds are measurements on C. spp, purple triangles are on C. lobulatus, and red circles are on M. barleeanum. In order to filter the higher frequency signal to better evaluate the longer-term temperature changes, we linearly interpolated our data to a 10-yr interval and then applied a 500-yr Gaussian filter to derive the time series shown (thick gray line), with a 1.3 °C error based on analytical uncertainty. Also shown is the ice-volume corrected benthic δ18O ( ) record from this core (blue line) during the last deglaciation (SI Text). (D) Number of ice-rafted detrital CaCO3 grains g-1 of sediment in core EW9302-2JPC, with increases in these grains identifying Heinrich layers 1 through 6 (SI Text). Vertical gray bars represent timing of Heinrich events on the independent ice core (A and B) and EW9302-2JPC core (C and D) chronologies.

