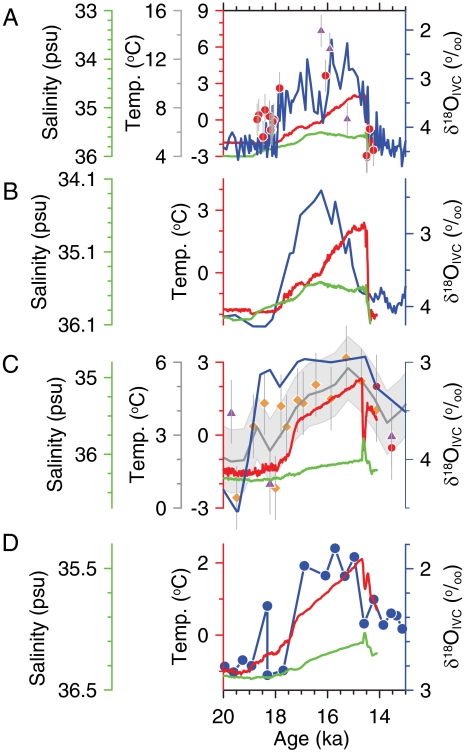
Fig. 4.
Comparison of  records from a subtropical North Atlantic site and two sites from the Nordic Seas (Fig. 1) with changes in temperature and salinity simulated by the CCSM3 model at these sites in response to the decrease in the AMOC shown in Fig. 3A. The temperature scale for each plot is equivalent to the associated
  scale assuming a temperature-dependent fractionation of 0.25‰ ° C-1 for calcite (18). (A) Ice-volume corrected benthic δ18O (
 ) record from core MD95-2010 (1,226 m depth; 66°41.05′ N, 04°33.97′ E) during the last deglaciation. Also shown is the temperature (red line) and salinity (green line) for the core site simulated by the NCAR CCSM3, and our new Mg/Ca-derived bottom water temperatures, where purple triangles are on C. lobulatus and red circles are on M. barleeanum. (B) As in A, but for core ENAM93-21 (1,020 m depth; 66°44.3′ N, 03°59.92′ E) (25). (C) Mg/Ca-derived bottom water temperatures for core EW9302-2JPC. Orange diamonds are measurements on C. spp., purple triangles are on C. lobulatus, and red circles are on M. barleeanum, with a 3-point weighted average (blue line). Also shown is the temperature (red line) and salinity (green line) for the core site simulated by the NCAR CCSM3. (D) As in A, but for core M35003-4 (1,299 m depth; 12°05′N, 61°15′W) (41).

