Fig. 1.
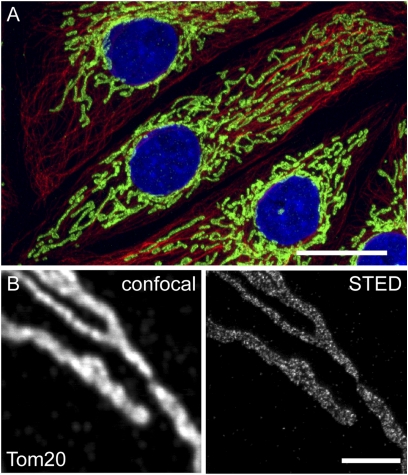
STED microscopy enables the analysis of submitochondrial protein distributions. (A) Mitochondria form a branched network within eukaryotic cells. The mitochondria (green) and the microtubule cytoskeleton (red) of PtK2 cells were labeled with antibodies specific for Tom20 and α-tubulin. The nuclei were labeled with DAPI (blue). (Scale bar: 20 μm.) (B) Mitochondria of PtK2 cells labeled with an antiserum against Tom20. STED microscopy (Right) reveals individual Tom20 clusters, which are blurred and not resolvable when using diffraction-limited confocal microscopy (Left). (Scale bar: 2 μm.)

