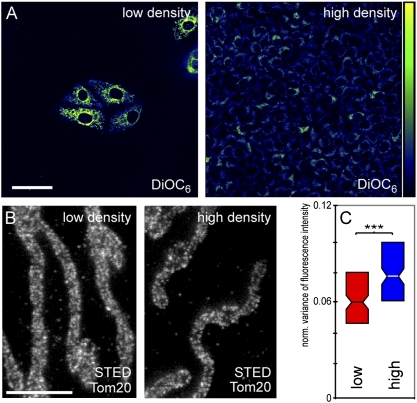
Fig. 4.
Growth conditions influence the distribution of the Tom20 clusters. PtK2 cells were seeded to low density (<10% confluence) or high density (>90% confluence) on coverslips. (A) Cells were stained with the membrane potential-sensitive dye DiOC6. (Left) Low confluence. (Right) High confluence. High fluorescence intensity indicates a high membrane potential.(Scale bar: 50 μm.) (B) STED imaging of cells labeled with a Tom20-specific antiserum. Shown are representative images of mitochondria of cells grown to low or high confluence, respectively. (Scale bar: 2 μm.) (C) Boxplots summarizing the quantitative analysis of 200 cells imaged by STED microscopy. Significance levels are as in Fig. 3.

