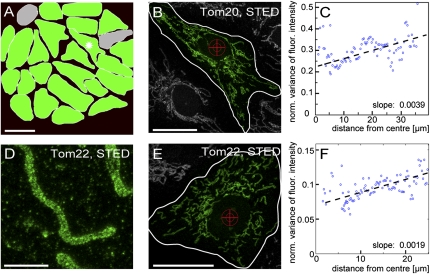
Fig. 6.
Density of TOM clusters is higher in the perinuclear mitochondria than in mitochondria at the cellular periphery. (A) Graphical representation of all cells of the microcolony shown in Fig. 5C. Green indicates cells in which the normalized variance of the fluorescence signal is lower in the perinuclear mitochondria (corresponding to a higher density of the TOM clusters) than in the cellular periphery. (For detailed data, see Fig. S6). Gray indicates cells in which the linear fits to the variance values have negative slopes. (Scale bar: 50 μm.) (B) Representative cell used for the analysis shown in C. Its location in the microcolony is indicated by an asterisk in A. The cross indicates the center, and the white line indicates the border of the cell as used for the subsequent analysis. (Scale bar: 20 μm.) (C) The normalized local variance values of the fluorescence signals radiating from the center of the cell to its border. Blue circles indicate 100 bins that pool the ∼3 × 10⁵ individual variance values. The black line indicates the linear fit based on the individual variance values. The positive slope of the curve indicates that the density of the TOM clusters is higher in mitochondria around the nucleus. (D) STED image of a mitochondrion of a Vero cell labeled with an antiserum against Tom22. (Scale bar: 2 μm.) (E) Representative Vero cell labeled with a Tom22 antiserum. (Scale bar: 20 μm.) (F) Analysis of the distribution of Tom22 in the cell shown in E. The analysis was performed as in C.

