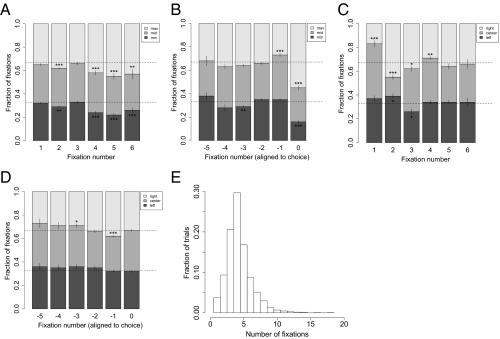
Fig. 4.
Fixation properties. (A) Fraction of fixations to items with the maximum, middle, and minimum ratings as a function of fixation number from the beginning of the trial, and (B) from the end of the trial (0 indicates the final fixation). (C) Fraction of fixations to the left, center, and right items as a function of fixation number from the beginning of the trial and (D) from the end of the trial (0 indicates the final fixation). (E) Histogram of the number of fixations that subjects made within a trial. Bars denote SEs. Tests are based on paired two-sided t tests against 33.33% for the two extremes in each panel (maximum and minimum, or left and right). *P = 0.05; **P = 0.0042 (Bonferroni corrected for the 12 tests in each panel), and ***P = 0.001 (Bonferroni corrected for all 48 tests in the figure).

