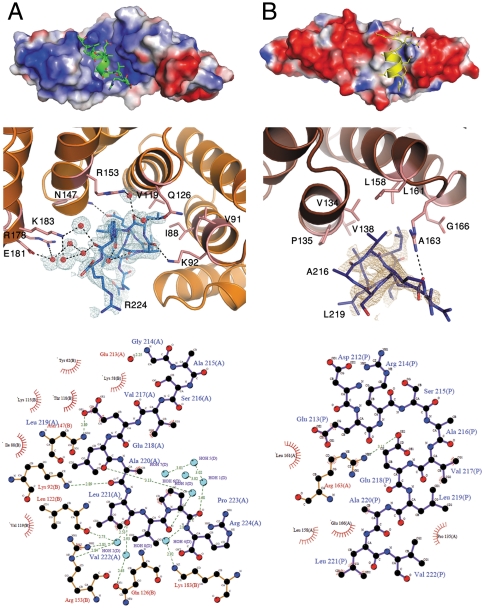
Fig. 5.
Helix binding at the concave and convex surfaces, mimicking natural MamA ligands. (A) The 3AS5 chain B concave binding site and 3AS5 chain BH11. (Top) 3AS5 chain B, in electrostatic surface display, binds H11 (green) at the central concave pocket. (Center) Detailed representation of interactions between 3AS5 chain B (light pink) and H11 (blue) residues. Water molecules involved in ligand binding are represented as red spheres. A 2.0 Å 2Fo - Fc electron density omit map was calculated and is presented around H11. The map is countered at 1.0σ (light blue). (Bottom) Interaction scheme between H11 (backbone in black) and 3AS5 chain B (backbone in brown). (B) 3AS8 convex binding site and the symmetry-related H11. (Top) 3AS8, in electrostatic surface display, binds H11 (yellow) at the TPR convex surface. (Center) Detailed representation of interactions between 3AS8 monomer (pink) and H11 (deep blue) residues. A 2.0 Å 2Fo - Fc electron density omit map was calculated and presented around H11. The map is countered at 1.0σ (light brown). (Bottom) Interaction scheme between H11 (backbone in black) and 3AS8 (backbone in brown). Interaction schemes were produced using LigPlot (35). An enlarged and detailed binding site image can be found in Fig. S7.

