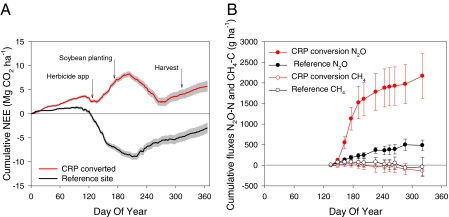
Fig. 1.
Cumulative fluxes of greenhouse gases from the studied systems. (A) Average cumulative NEE from three CRP grasslands converted to no-till soybean (red line) compared with a CRP grassland reference site (black line) during 2009. Positive values indicate net CO2 emission from the ecosystems. Gray areas show the SD of cumulative NEE. Herbicide was first applied to the CRP grassland on day of year (DOY) 125; soybeans were sown on DOY 160 and harvested on DOY 310. (B) Average cumulative emissions of N2O (N2O − N g·ha−1; solid symbols) and CH4 (CH4 − C g·ha−1; open symbols) at the study sites during the 2009 growing season. Black lines and symbols represent the CRP reference site and red lines and symbols represent converted sites. Error bars are quadratic sums of component SEs (n = 3 replicate fields for converted CRP and n = 4 replicates within one field for reference CRP; see SI Text for details). Note different units in A and B.

