. Author manuscript; available in PMC: 2012 Aug 25.
Published in final edited form as: J Med Chem. 2011 Aug 2;54(16):5660–5670. doi: 10.1021/jm200696v

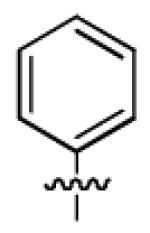
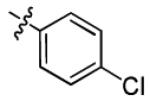
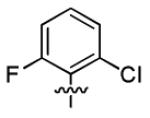
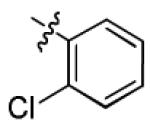
Table 1.

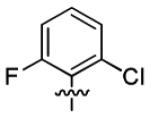
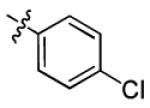
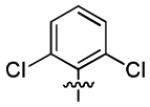
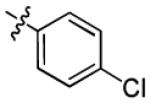
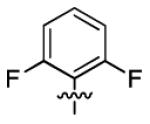
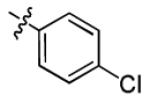
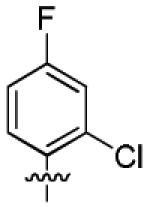
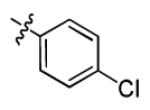
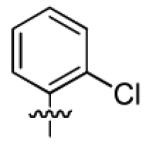
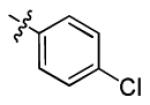
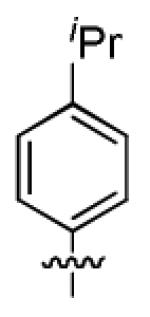
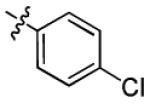
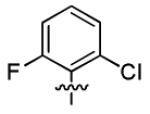
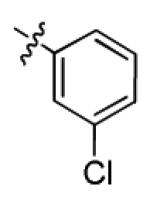
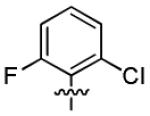
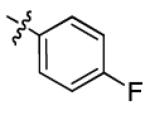
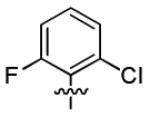
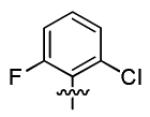
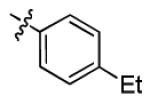
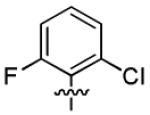
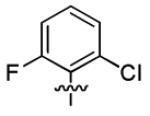
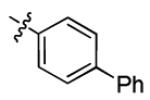
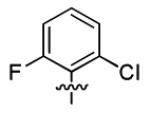
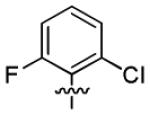
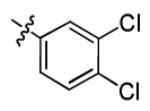
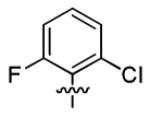
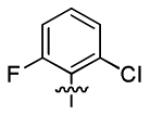
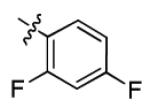
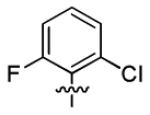
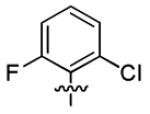
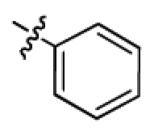
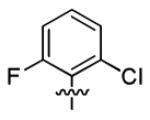
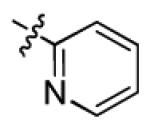
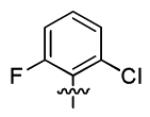
SAR Study on A, C and D Rings: EC50s of 1a-v, Compared with 5a

graphic file with name nihms-315405-f0008.jpg

Compounds C ring D ring ELISA, EC50 (μM) MTT, CC50 (μM)
5 - - 11.3 ± 3.2 > 50
1a graphic file with name nihms-315405-t0009.jpg graphic file with name nihms-315405-t0010.jpg 4.1 ± 2.1 > 50
1b graphic file with name nihms-315405-t0011.jpg graphic file with name nihms-315405-t0012.jpg 4.7 ± 1.9 > 50
1c graphic file with name nihms-315405-t0013.jpg graphic file with name nihms-315405-t0014.jpg 2.7 ± 1.0 > 50
1d graphic file with name nihms-315405-t0015.jpg graphic file with name nihms-315405-t0016.jpg 2.7 ± 0.7 > 50
1e graphic file with name nihms-315405-t0017.jpg graphic file with name nihms-315405-t0018.jpg 3.0 ± 0.7 > 50
1f graphic file with name nihms-315405-t0019.jpg graphic file with name nihms-315405-t0020.jpg 8.8 ± 3.2 > 50
1g graphic file with name nihms-315405-t0021.jpg graphic file with name nihms-315405-t0022.jpg 34.2 ± 13.6 > 50
1h graphic file with name nihms-315405-t0023.jpg graphic file with name nihms-315405-t0024.jpg 3.2 ± 1.8 > 50
1i graphic file with name nihms-315405-t0025.jpg graphic file with name nihms-315405-t0026.jpg 12.1 ± 3.6 > 50
1j graphic file with name nihms-315405-t0027.jpg graphic file with name nihms-315405-t0028.jpg 5.9 ± 3.3 > 50
1k graphic file with name nihms-315405-t0029.jpg graphic file with name nihms-315405-t0030.jpg 2.1 ± 1.0 > 50
1l graphic file with name nihms-315405-t0031.jpg graphic file with name nihms-315405-t0032.jpg 7.4 ± 1.7 > 50
1m graphic file with name nihms-315405-t0033.jpg graphic file with name nihms-315405-t0034.jpg 46.6 ± 3.2 > 50
1n graphic file with name nihms-315405-t0035.jpg graphic file with name nihms-315405-t0036.jpg 3.0 ± 1.3 > 50
1o graphic file with name nihms-315405-t0037.jpg graphic file with name nihms-315405-t0038.jpg 2.9 ± 0.7 > 50
1p graphic file with name nihms-315405-t0039.jpg graphic file with name nihms-315405-t0040.jpg 5.2 ± 1.9 > 50
1q graphic file with name nihms-315405-t0041.jpg graphic file with name nihms-315405-t0042.jpg 5.7 ± 1.9 > 50
1r graphic file with name nihms-315405-t0043.jpg graphic file with name nihms-315405-t0044.jpg 11.2 ± 2.2 > 50
1s graphic file with name nihms-315405-t0045.jpg graphic file with name nihms-315405-t0046.jpg 2.2 ± 0.5 > 50
1t graphic file with name nihms-315405-t0047.jpg graphic file with name nihms-315405-t0048.jpg 40.8 ± 15.9 > 50
1u graphic file with name nihms-315405-t0049.jpg graphic file with name nihms-315405-t0050.jpg > 50 > 50
1v graphic file with name nihms-315405-t0051.jpg graphic file with name nihms-315405-t0052.jpg > 50 > 50
a

EC50: 50% effective concentration, measured by the HBsAg ELISA assay; CC50: 50% cytotoxic concentration, measured by the MTT assay; both CC50 and EC50 are the average of at least two independent determinations.