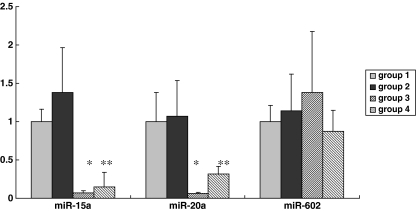
Fig. 5.
Dynamic expression of hsa-miRNA-15a, hsa-miRNA-20a and hsa-miRNA-602. Group 1–4 corresponds to GV, MI, MII oocytes matured at normal FSH level, and MII oocytes matured at high FSH level, respectively. The average Ct values of hsa-miR-15a were 31.00 ± 0.43, 30.53 ± 0.30, 34.75 ± 0.30 and 33.69 ± 0.34 in group 1–4 respectively. The average Ct values of hsa-miR-20a were 29.21 ± 0.39, 29.10 ± 0.27, 33.27 ± 0.63 and 30.85 ± 0.41 in group 1–4 respectively. The average Ct values of hsa-miR-602 were 34.10 ± 0.67, 34.16 ± 0.35, 34.05 ± 0.46 and 35.04 ± 0.45 in group 1–4 respectively. * P < 0.001 compared to group 1 and group 2, ** P < 0.05 compared to group 3

