
Figure 1.
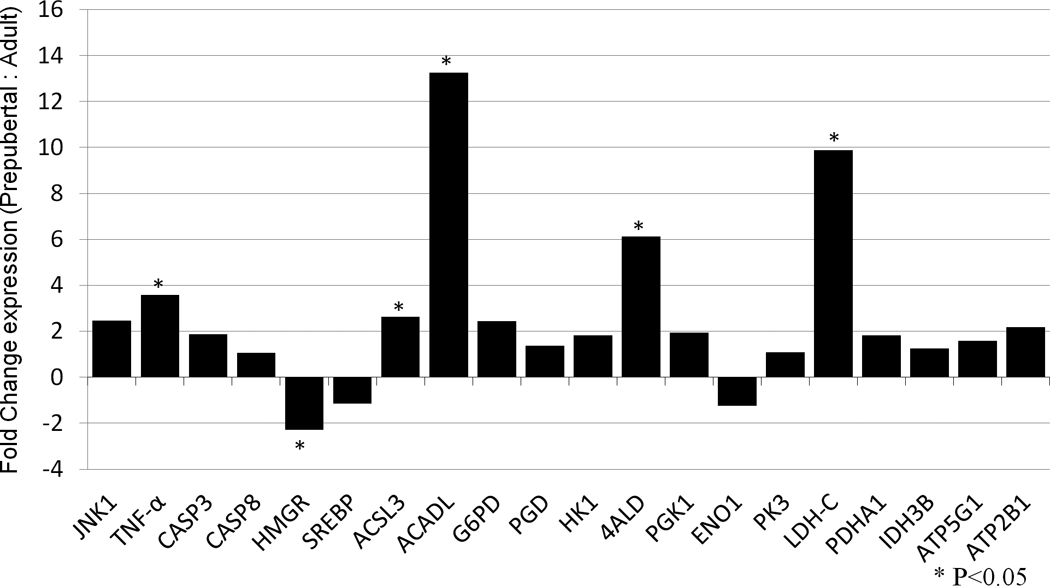
Expression of 20 target genes in oocytes derived from prepubertal compared to adult pigs, determined by qPCR analyses and relative to GAPDH. Bars above the x-axis represent genes that were upregulated in prepubertal oocytes; bars below x-axis represent genes that were upregulated in adult oocytes. * represents a significant difference in gene expression between prepubertal and adult oocytes (P <0.05).