
Figure 2.
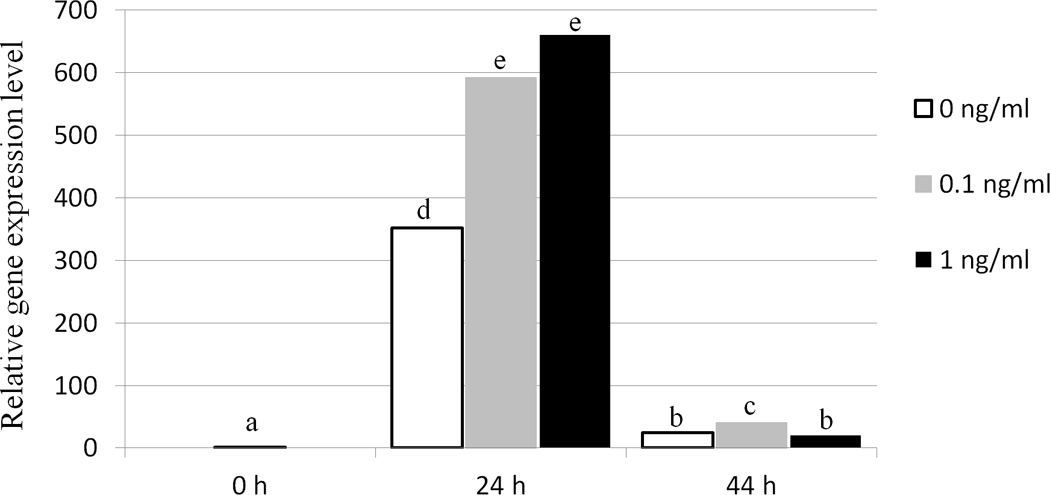
Relative expression of TNFAIP6 in porcine cumulus cells treated with different concentrations of TNF (0 ng/ml, 0.1 ng/ml, 1 ng/ml) during in vitro maturation, as determined by qPCR analysis. Data were normalized to TNFAIP6 expression at 0 h post maturation. Columns with different superscript letters differ significantly between time points and TNF treatments (P <0.05).