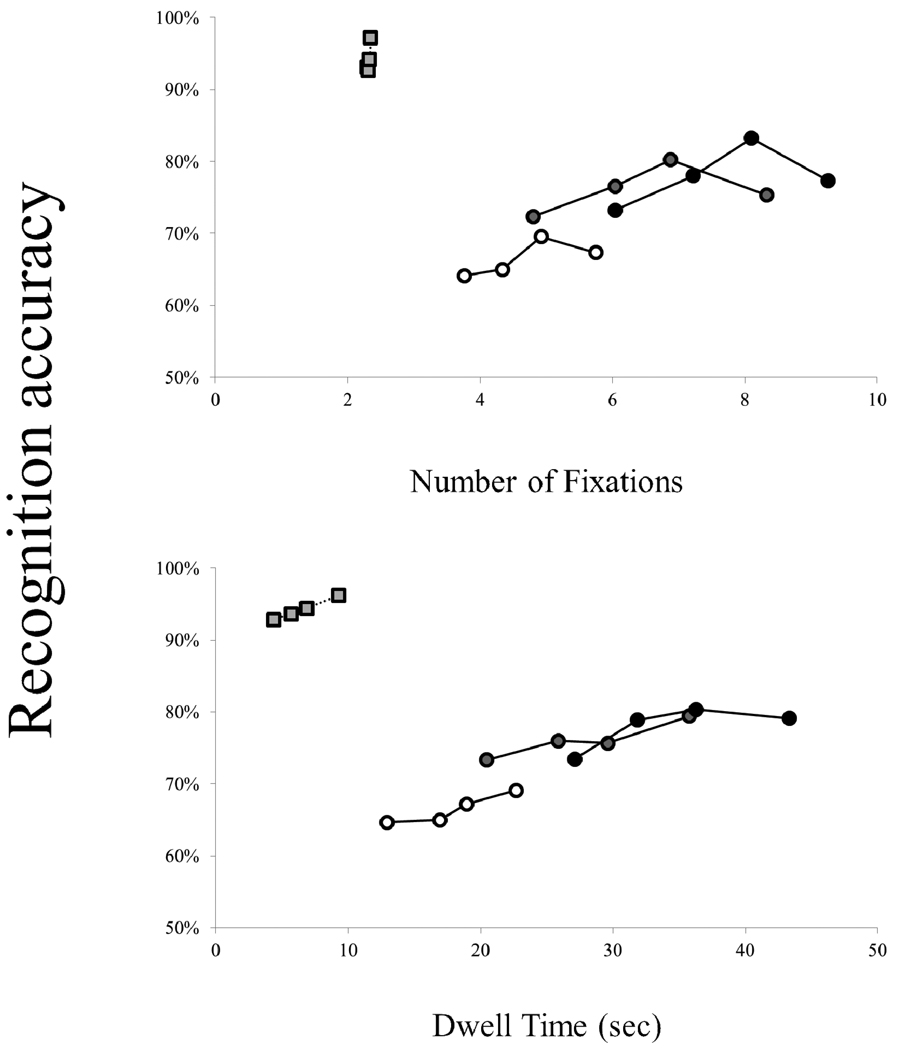
Figure 11.
Probability of correct recognition of distractors and targets, as a function of total number of fixations, and total dwell time, from Experiment 2. Results were divided into quartile bins for each load group, and plotted against the mean accuracy per quartile. Memory for distractors is indicated by white, gray, and black circles for low-, medium-, and high-load groups, respectively. Squares indicate memory for targets, collapsed across WM Load.

