
Figure 3.
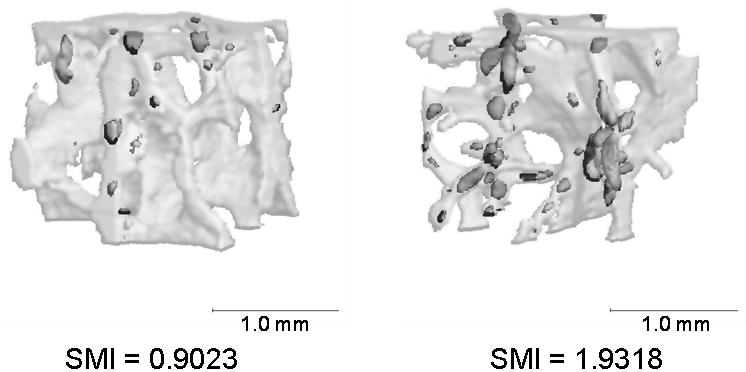
Representative images of bone with low and high SMI values. Bone with higher SMI accumulates more microdamage. Images shown are central volumetric cubes with stained regions represented by dark grey and the whole bone volume represented by light grey.