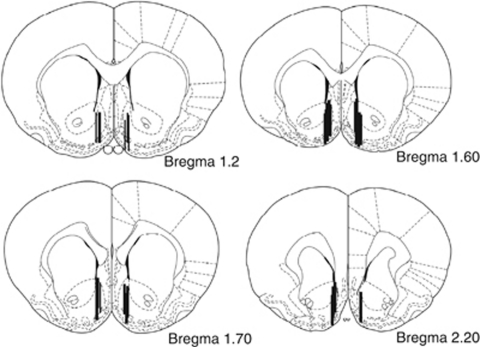
Figure 1.
Diagrams of coronal sections from the rat brain atlas (Paxinos and Watson, 1998). Marked lines represent histologically confirmed locations of microdialysis probe tips (active membrane) in the nucleus accumbens (NAcc) shell from animals that were included in the statistical analyses for all experiments. Numbers next to the coronal section indicate the distance from bregma in millimeters.

