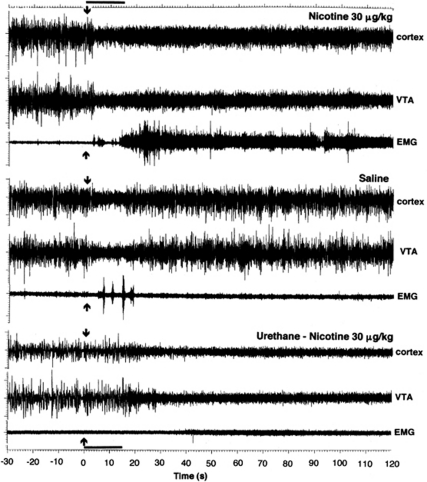
Figure 1.
Original examples of changes in electrical activity in the cortex, VTA, and neck muscle (EMG) following i.v. injections of NIC and saline. The bottom graphs show response to i.v. NIC during urethane anesthesia. The data are shown for 30 s preceding and 120 s following each injection. Arrows at 0 s show the injection onset, and the duration of injection (15 s) is shown as bold horizontal line at time axis.

