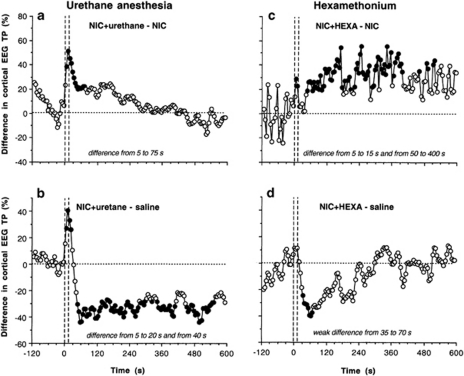
Figure 5.
Contributions of sensory mechanisms (urethane anesthesia) and peripheral drug actions (HEXA) in mediating NIC-induced cortical EEG desynchronization. Left column shows differences in changes of cortical EEG total power induced by NIC (30 μg/kg) during anesthesia and no anesthesia (a, NIC+urethane−NIC) and NIC (30 μg/kg) during anesthesia and saline in unanesthetized conditions (b, NIC+urethane−saline). Right column shows differences in changes of cortical EEG total power induced by NIC (30 μg/kg) after HEXA (5 mg/kg, i.v.) pre-treatment and in control, drug-free conditions (c, NIC+HEXA−NIC) and NIC (30 μg/kg) after HEXA pre-pretreatment and saline in drug-free conditions (d, NIC+HEXA−saline). Vertical hatched lines show the onset and offset of 15-s injection and horizontal hatched lines display zero between-group difference. Filled symbols indicate significant between-group differences (p<0.05; Student's t-test). Time intervals of significant between-group differences are specified in right bottom corners of each graph. For other explanations, see the text.

