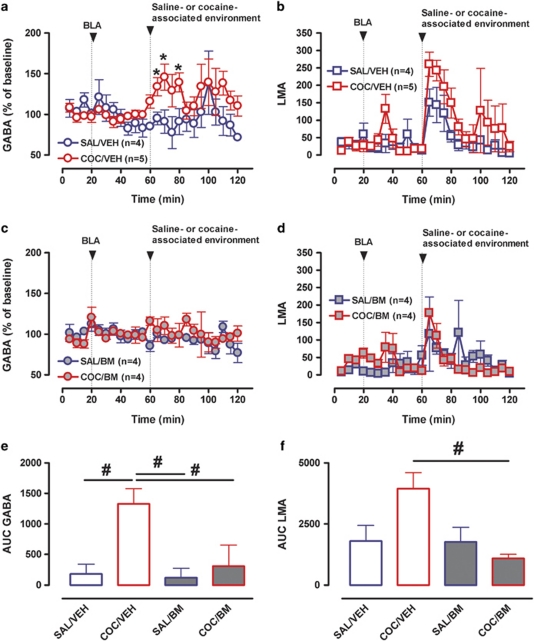
Figure 4.
Influence of BLA inactivation on LMA and mPFC GABA neurotransmission produced by exposure to the cocaine- or saline-associated environment. (a) Time course of mPFC GABA overflow before and after introduction of the saline- (blue circles) or cocaine- (red circles) associated environment in rats that received microinjections of either vehicle (VEH, open symbols) or the GABAB (baclofen, 1 mM)/GABAA (muscimol, 0.1 mM) agonists (BM, closed symbols) into the BLA. (b) Time course of LMA before and after introduction of the saline- (blue squares) or cocaine- (red squares) associated environment following BLA microinjection of either vehicle (VEH, open symbols) or BM (closed symbols). (c) Bar graphs of AUC values for mPFC GABA overflow expressed as means±SEM. (d) Bar graphs of AUC values for LMA expressed as means±SEM. *Indicates significant changes from baseline (p⩽0.05). #Indicates significant difference between groups (one-way ANOVA; p⩽0.05).

