Figure 4.
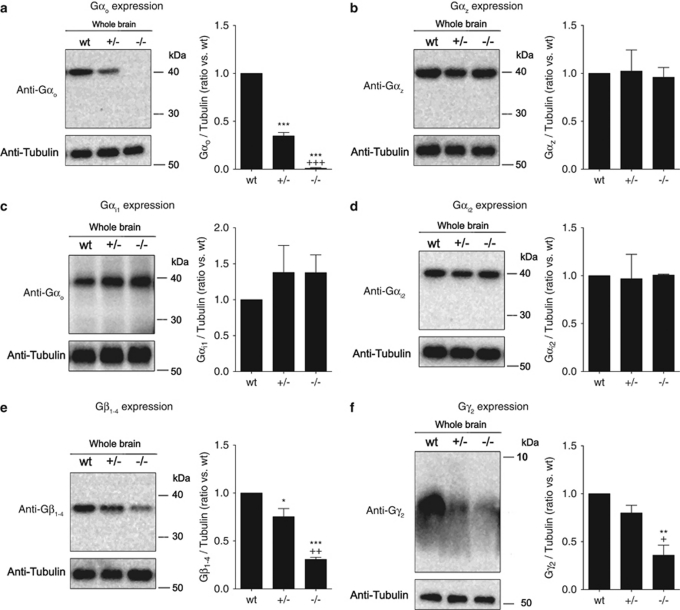
G protein expression in whole brain homogenates from Gαo transgenic mice. Membranes from whole brain of wild-type (wt), Gαo +/− (+/−), and Gαo −/− (−/−) mice were separated by SDS-PAGE, transferred to nitrocellulose membranes, and probed for the expression of (a) Gαo, (b) Gαz, (c) Gαi1, (d) Gαi2, (e) Gβ1−4, or (f) Gγ2 using selective antibodies (see Materials and Methods section); membranes were also probed for tubulin as a loading control. G protein expression was quantified in Image J by normalizing G protein band intensity to tubulin band intensity, and data are plotted as a ratio of wt expression. Data represent the mean±SEM (n=3). Symbols indicate a statistical difference vs wt (*p<0.05, **p<0.01, ***p<0.001) or +/− (+p<0.05, ++p<0.01, +++p<0.001) by Bonferroni's post-test.

